
فائل:Interpolation example spline.svg

اس SVG فائل کی PNG نمائش کا حجم: 600 × 480 پکسلز دیگر تصمیمات: 300 × 240 پکسلز | 960 × 768 پکسلز | 1,280 × 1,024 پکسلز | 2,560 × 2,048 پکسلز۔
اصل فائل (ایس وی جی فائل، ابعاد 600 × 480 پکسل، فائل کا حجم: 13 کلوبائٹ)
خلاصہ
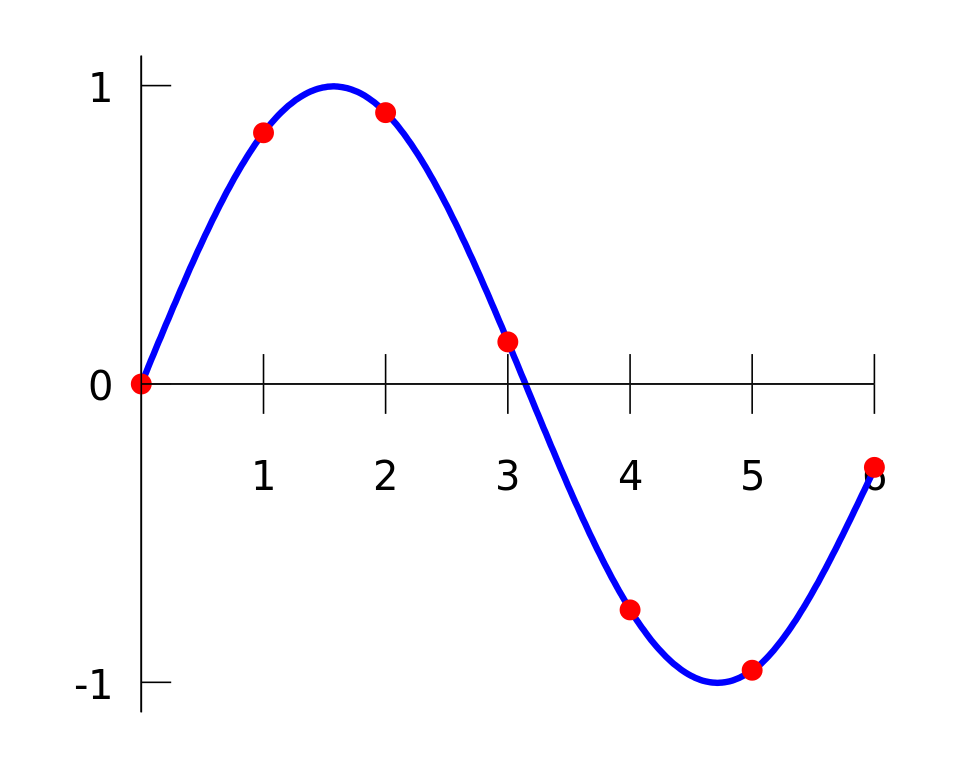
| تفصیل | IIllustration of spline interpolation of a data set. The same data set is used for other interpolation algorithms in the Interpolation. |
| تاریخ | |
| ماخذ | self-made in Gnuplot |
| مصنف | Berland |
Based on png-version by User:Jitse Niesen (with gnuplot source code), and on svg-version by User:Cronholm144.
Gnuplot source code
set terminal svg fname "Vera" fsize 25
set output "Interpolation_example_spline.svg"
set key off
set xzeroaxis
set xtics axis 1,1
set ytics nomirror 1
set samples 300
set border 2
f(x) = (x >= 0 && x < 1) ? -0.1522*x**3 + 0.9937*x : \
       (x >= 1 && x < 2) ? -0.01258*x**3 - 0.4189*x**2 + 1.4126*x - 0.1396 : \
       (x >= 2 && x < 3) ? 0.1403*x**3 - 1.3359*x**2 + 3.2467*x - 1.3623 : \
       (x >= 3 && x < 4) ? 0.1579*x**3 - 1.4945*x**2 + 3.7225*x - 1.8381 : \
       (x >= 4 && x < 5) ? 0.05375*x**3 -0.2450*x**2 - 1.2756*x + 4.8259 : \
                           -0.1871*x**3 + 3.3673*x**2 - 19.3370*x + 34.9282
set yrange [-1.1:1.1]
plot f(x) with lines linetype 3 linewidth 4, \
     "-" with points linetype 1 pointtype 7 pointsize 0.7,\
	 0 with lines linetype -1 linewidth 1
0 0
1 0.8415
2 0.9093
3 0.1411
4 -0.7568
5 -0.9589
6 -0.2794
e
Please use at least version 4.2 of Gnuplot for smooth lines in SVG.
اجازہ کاری
| تخلیق کار I, Berland نے اس کام کو دائرہ عام میں شائع کیا ہے جس کا اطلاق عالمی سطح پر ہوتا ہے۔ بعض ملکوں میں یہ قانونی طور پر شاید ممکن نہ ہو؛ اگر ایسا ہے تو: I, Berland ہر ایک کو کسی بھی مقصد کے لیے بغیر کسی شرط کے اس تصویر کے استعمال کا حق تفویض کرتا/کرتی ہے، بجز اس صورت کے جس میں کوئی قانونی رکاوٹ موجود ہو۔ |
فائل کا تاریخچہ
کسی خاص وقت یا تاریخ میں یہ فائل کیسی نظر آتی تھی، اسے دیکھنے کے لیے اس وقت/تاریخ پر کلک کریں۔
| تاریخ/وقت | تھمب نیل | ابعاد | صارف | تبصرہ | |
|---|---|---|---|---|---|
| رائج الوقت | 21:02، 25 جون 2007ء | | 600 × 480 (13 کلوبائٹ) | Berland | {{Information |Description=Illustration of spline interpolation on a data set, compared with other interpolation methods in the article Interpolation. Based on png-version by User:Jitse Niesen and svg |
| 15:30، 23 جون 2007ء |  | 429 × 425 (14 کلوبائٹ) | Cronholm144 | {{Information |Description=Interpolation example spline |Source=self-made |Date=06-23-07 |Author= Cronholm144 }} |
روابط
درج ذیل صفحہ اس فائل کو استعمال کر رہا ہے:
فائل کا عالمی استعمال
مندرجہ ذیل ویکیوں میں یہ فائل زیر استعمال ہے:
- ar.wikipedia.org پر استعمال
- bs.wikipedia.org پر استعمال
- de.wikipedia.org پر استعمال
- en.wikipedia.org پر استعمال
- et.wikipedia.org پر استعمال
- eu.wikipedia.org پر استعمال
- fr.wikipedia.org پر استعمال
- hr.wikipedia.org پر استعمال
- hu.wikipedia.org پر استعمال
- it.wikipedia.org پر استعمال
- ja.wikipedia.org پر استعمال
- mn.wikipedia.org پر استعمال
- no.wikipedia.org پر استعمال
- simple.wikipedia.org پر استعمال
- sq.wikipedia.org پر استعمال
- ta.wikipedia.org پر استعمال
- zh.wikipedia.org پر استعمال