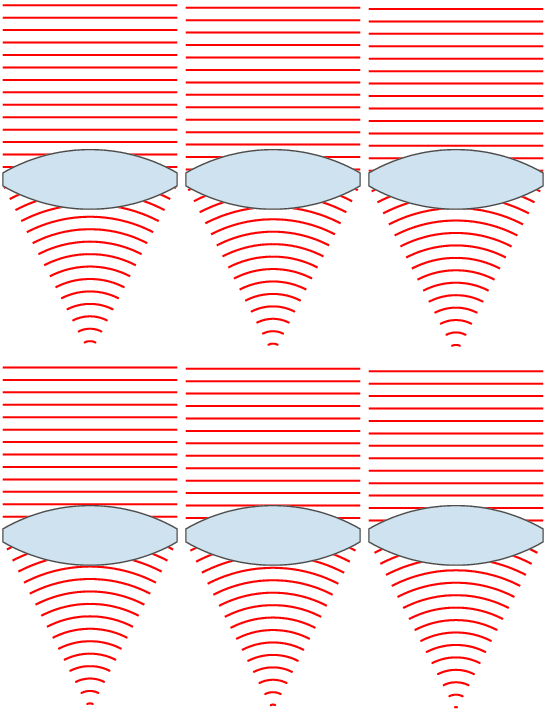
فائل:Lens and wavefronts.gif

صفحے کے مندرجات دوسری زبانوں میں قابل قبول نہیں ہیں۔
آزاد دائرۃ المعارف، ویکیپیڈیا سے

Lens_and_wavefronts.gif(183 × 356 پکسل، فائل کا حجم: 35 کلوبائٹ، MIME قسم: image/gif، چکردار، 9 چوکھٹے، 0.7 سیکنڈ)

یہ فائل ویکی ذخائر کی ہے اور دیگر منصوبوں کے زیر استعمال ہوسکتی ہے۔ فائل کے صفحہ تعارف پر موجود تعارف ذیل میں موجود ہے۔

slnglelens

خلاصہ

تفصیل Illustration of wavefronts after passing through a lens. Interestingly, to produce a point source reverse the direction of the waves, with the focus point acting as a point source.
تاریخ (UTC)
ماخذ self-made with MATLAB
مصنف Oleg Alexandrov
دوسرے نسخے
 
This diagram was created with MATLAB.

اجازہ کاری

Public domain میں اس تخلیقی کام کے حقوق کا مالک ہوں اور اسے دائرہ عام میں شائع کرتا ہوں جس کا اطلاق عالمی سطح پر ہوتا ہے۔
بعض ملکوں میں یہ قانونی طور پر شاید ممکن نہ ہو؛ اگر ایسا ہے تو:
میں ہر ایک کو کسی بھی مقصد کے لیے بغیر کسی شرط کے اس تصویر کے استعمال کا حق تفویض کرتا/کرتی ہوں، بجز اس صورت کے جس میں کوئی قانونی رکاوٹ موجود ہو۔

siingleline

% Illustration of planar wavefronts going through a lens and getting focused
% into a converging spherical wave

function main ()

  % lens index
   n=1.5; 

  % number of points, used for plotting
   N = 100;

  % radii of lens surfaces
   R1 = 0.5; 
   R2 = 1.5;

  % centers of circles (y coord is 0)
   O1 = -2.9;
   O2 = -O1;

  % focal length
   f = (n-1)*(1/R1+1/R2); f = 1/f;
   
   % theta0 determines the width of the lens
   theta0=pi/6;
   Theta = linspace(-theta0, theta0, N);

  % right face of the lens
   L1x = R1*cos(Theta)+O1;
   L1y =R1*sin(Theta); 

   % left size of the lens
   L2x=-R2*cos(Theta)+O2;
   L2y = R2*sin(Theta);

   % flat top part
   Topx = [L1x(N), L2x(N)];
   Topy = [L1y(N), L2y(N)];

   % flat bottom part
   Botx = [L1x(1) L2x(1)];
   Boty = [L1y(1), L2y(1)];

   % the lens
   Lensx = [L1x rv_vec(Topx), rv_vec(L2x), Botx];
   Lensy = [L1y rv_vec(Topy), rv_vec(L2y), Boty];

   % Parameters for graphing
   Lens_color  = [204, 226, 239]/256;
   Lens_border = 0.3*[1, 1, 1];
   lbw = 1.3; % lens border width
   wavefr_color = [1, 0, 0];
   wavefr_bdw   = 2;
   
   % spacing between wavefronts (both plane and spherical ones)
   spacing = 0.25;

   % 2*H is the height of the plane wavefronts
   H = L1y(N); 

   % theta2 = slope of the line going from the upper-right
   % end of the lens to the focus point
   theta2 = atan(L1y(N)/(f-L1x(N)));

   % Shape of the spherical wavefronts.
   Theta = linspace(-theta2, theta2, N);
   X = -cos(Theta);
   Y =  sin(Theta);

   S = -f; % start ploting waves from here to the right

   % number of frames in the movie
   num_frames = 10;
   Shifts = linspace(0, spacing, num_frames+1);

   % start at S+shift, plot the wavefronts
   for frame_no = 1:num_frames

      shift = Shifts(frame_no);
      
      s = S+shift;

      % plotting window
      figure(1); clf; hold on; axis equal; axis off;

      % plot the plane wavefronts
      while s < 0
         plot([s, s], [-H, H], 'color', wavefr_color, 'linewidth', wavefr_bdw);
         s = s + spacing;
      end
      
   
      % plot the spherical wavefronts
      s = s - 10*spacing; % backtrack a bit
      while s < f
         
         rho = f-s;
         
         if rho*Y(N) <= L1y(N)
            plot(rho*X+f, rho*Y, 'color', wavefr_color, 'linewidth', wavefr_bdw);
         end
         
         s = s + spacing;
         
      end

      % plot the lens
      fill(Lensx, Lensy, Lens_color, 'EdgeColor', Lens_border, 'LineWidth', lbw);
%      get(H)
%      return
      
      % Invisible points to force MATLAB to keep the
      % plotting window fixed.
      tiny = 0.15*spacing;
      white = 0.999*[1, 1, 1];
      plot(S-tiny,   H+tiny, 'color', white);
      plot(S-tiny,  -H-tiny, 'color', white);
      plot(f+tiny,   H+tiny, 'color', white);
      plot(f+tiny,  -H-tiny, 'color', white);

      % Rotate by 90 degrees
      set(gca, 'View', [90, 90])

      % save current file
      frame_file = sprintf('Frame%d.eps', 1000+frame_no);
      disp(frame_file);
      saveas(gcf, frame_file, 'psc2');
      pause(0.07)
   end

% The frames were converted to a movie with the command
% convert -antialias -loop 10000  -delay 8 -compress LZW Frame100* Lens_and_wavefronts.gif
   
function W = rv_vec(V)

   K = length(V);

   W = V;
   for i=1:K
      W(i) = V(K-i+1);
   end

Captions

Add a one-line explanation of what this file represents
Siingleline

Items portrayed in this file

عکاسی

24 نومبر 2007

MIME type انگریزی

image/gif

فائل کا تاریخچہ

کسی خاص وقت یا تاریخ میں یہ فائل کیسی نظر آتی تھی، اسے دیکھنے کے لیے اس وقت/تاریخ پر کلک کریں۔

تاریخ/وقتتھمب نیلابعادصارفتبصرہ
رائج الوقت06:35، 25 نومبر 2007ءمورخہ 06:35، 25 نومبر 2007ء کا تھمب نیل183 × 356 (35 کلوبائٹ)Oleg Alexandrovtweak
04:10، 24 نومبر 2007ءمورخہ 04:10، 24 نومبر 2007ء کا تھمب نیل171 × 356 (33 کلوبائٹ)Oleg Alexandrovtweak
04:09، 24 نومبر 2007ءمورخہ 04:09، 24 نومبر 2007ء کا تھمب نیل171 × 356 (33 کلوبائٹ)Oleg Alexandrovtweak
00:56، 24 نومبر 2007ءمورخہ 00:56، 24 نومبر 2007ء کا تھمب نیل171 × 359 (33 کلوبائٹ)Oleg Alexandrovtweak, same license
00:53، 24 نومبر 2007ءمورخہ 00:53، 24 نومبر 2007ء کا تھمب نیل171 × 359 (32 کلوبائٹ)Oleg Alexandrovtweak
00:49، 24 نومبر 2007ءمورخہ 00:49، 24 نومبر 2007ء کا تھمب نیل151 × 359 (31 کلوبائٹ)Oleg Alexandrov{{Information |Description=Illustration of wavefronts after passing through a [:en:lens (optics)|lens]] |Source=self-made with MATLAB |Date=~~~~~ |Author= Oleg Alexandrov |Permission=see below |other_versions= }}

درج ذیل صفحہ اس فائل کو استعمال کر رہا ہے:

فائل کا عالمی استعمال

مندرجہ ذیل ویکیوں میں یہ فائل زیر استعمال ہے:

اس فائل کا مزید عالمی استعمال دیکھیے۔