
"فہرست ممالک بلحاظ پیداوار موٹر گاڑیاں" کے نسخوں کے درمیان فرق
حذف شدہ مندرجات اضافہ شدہ مندرجات
م خودکار: درستی املا ← ے \1؛ تزئینی تبدیلیاں |
1 مآخذ کو بحال کرکے 0 پر مردہ ربط کا ٹیگ لگایا گیا) #IABot (v2.0.9.5 |
||
| سطر 7: | سطر 7: | ||
{| class="wikitable sortable" |
{| class="wikitable sortable" |
||
|- bgcolor="#ececec" |
|- bgcolor="#ececec" |
||
! درجہ !! ملک / علاقہ !! 2011<br/><ref>[http://oica.net/category/production-statistics/ OICA 2011 statistic]</ref><ref name=OICA11>[http://oica.net/wp-content/uploads/total-2011.pdf OICA. World Motor Vehicle Production by country 2010-2011]</ref> !! 2010<br/><ref name=OICA11/><ref>[http://oica.net/wp-content/uploads/all-vehicles-2010.pdf OICA 2010 statistic]</ref> !! 2005<br/><ref>[http://oica.net/wp-content/uploads/2007/06/worldproduction_country2005-2.pdf OICA 2005 statistic]</ref> !! 2000<br/><ref>[http://oica.net/wp-content/uploads/worldprod_country.PDF OICA 2000 statistic]</ref><ref name=RITA>RITA. [http://www.bts.gov/publications/national_transportation_statistics/html/table_01_23.html Table 1-23: World Motor Vehicle Production, Selected Countries]</ref> !! 1995<br/><ref name=RITA/><ref name=IMF2000>{{Cite web |url=http://www.imfmetal.org/files/auto2000_english.pdf |title=IMF Auto Report 2000 |access-date=2011-08-17 |archive-date=2011-08-17 |archive-url=https://web.archive.org/web/20110817162615/http://www.imfmetal.org/files/auto2000_english.pdf |url-status=live }}</ref> !! 1990<br/><ref name=OICAmore>OICA: [http://oica.net/category/production-statistics Production Statistics]</ref><ref name=WMVD>Ward's: ''World Motor Vehicle Data 2007''. - Wards Communications, Southfield MI 2007, ISBN 0910589534</ref><ref name=Mich>[http://books.google.com/books?id=2kSAiAOmq3oC&pg=PA461&lpg=PA461&dq="by%20celected%20country"+motor+vehicles+-wikipedia&source=bl&ots=7L4HM4sC_f&sig=gcwCbObJhdizBq6wdYFraFKozFM&hl=ru&sa=X&ei=AYQfUNmAJIyEhQexrYDgCg&ved=0CEYQ6AEwAA#v=onepage&q="12,702,782"%20motor%20vehicles%20&f=false ''Michigan Statistical Abstract 1996''. Table XIV-1 - Univercity of Michigan, 1996] ISBN 0-472-08370-8</ref> !! 1980<br/><ref name=OICAmore/><ref name=WMVD/><ref name=Mich/><ref name=UAM>[http://148.206.53.231/UAM3513.PDF UNIVERSIDAD AUTONOMA METROPOLITANA UNIDAD El sector automotriz Mexicano ante el tratado de libre comercio de america del norte, 1994]{{مردہ ربط|date=December 2020 |bot=InternetArchiveBot }}</ref> !! 1970<br/><ref name=OICAmore/><ref name=WMVD/><ref name=Mich/><ref name=UAM/> !! 1960<br/><ref name=OICAmore/><ref name=WMVD/><ref name=Mich/><ref name=UAM/> !! 1950<br/><ref name=OICAmore/><ref name=WMVD/> !! بہترین<br/>معطیات<br/><ref name=OICAmore/><ref name=WMVD/><ref name=RITA/><ref name=FREY>{{Cite web |url=http://www.freyssenet.com/files/* |title=Production automobile mondiale par continent et pour les principaux pays constructeurs,1898 2011.xls Production automobile mondiale par continent et pour les principaux pays constructeurs,1898-2011 (Tableau mde, contint, grds pays) |access-date=2013-01-28 |archive-date=2008-04-05 |archive-url=https://web.archive.org/web/20080405053803/http://freyssenet.com/files/%20Division%20mate%CC%81rielle%20et%20organisationnelle%20du%20travail%20d%20aiguillage%20des%20trains.pdf |url-status=dead }}</ref><ref name=IMF2000/><ref name=Mich/> !! بہترین<br/>سال<br/><ref name=OICAmore/><ref name=WMVD/><ref name=RITA/><ref name=FREY/><ref name=IMF2000/><ref name=Mich/> |
! درجہ !! ملک / علاقہ !! 2011<br/><ref>[http://oica.net/category/production-statistics/ OICA 2011 statistic]</ref><ref name=OICA11>[http://oica.net/wp-content/uploads/total-2011.pdf OICA. World Motor Vehicle Production by country 2010-2011]</ref> !! 2010<br/><ref name=OICA11/><ref>[http://oica.net/wp-content/uploads/all-vehicles-2010.pdf OICA 2010 statistic]</ref> !! 2005<br/><ref>[http://oica.net/wp-content/uploads/2007/06/worldproduction_country2005-2.pdf OICA 2005 statistic]</ref> !! 2000<br/><ref>[http://oica.net/wp-content/uploads/worldprod_country.PDF OICA 2000 statistic]</ref><ref name=RITA>RITA. [http://www.bts.gov/publications/national_transportation_statistics/html/table_01_23.html Table 1-23: World Motor Vehicle Production, Selected Countries] {{wayback|url=http://www.bts.gov/publications/national_transportation_statistics/html/table_01_23.html |date=20170729051608 }}</ref> !! 1995<br/><ref name=RITA/><ref name=IMF2000>{{Cite web |url=http://www.imfmetal.org/files/auto2000_english.pdf |title=IMF Auto Report 2000 |access-date=2011-08-17 |archive-date=2011-08-17 |archive-url=https://web.archive.org/web/20110817162615/http://www.imfmetal.org/files/auto2000_english.pdf |url-status=live }}</ref> !! 1990<br/><ref name=OICAmore>OICA: [http://oica.net/category/production-statistics Production Statistics]</ref><ref name=WMVD>Ward's: ''World Motor Vehicle Data 2007''. - Wards Communications, Southfield MI 2007, ISBN 0910589534</ref><ref name=Mich>[http://books.google.com/books?id=2kSAiAOmq3oC&pg=PA461&lpg=PA461&dq="by%20celected%20country"+motor+vehicles+-wikipedia&source=bl&ots=7L4HM4sC_f&sig=gcwCbObJhdizBq6wdYFraFKozFM&hl=ru&sa=X&ei=AYQfUNmAJIyEhQexrYDgCg&ved=0CEYQ6AEwAA#v=onepage&q="12,702,782"%20motor%20vehicles%20&f=false ''Michigan Statistical Abstract 1996''. Table XIV-1 - Univercity of Michigan, 1996] ISBN 0-472-08370-8</ref> !! 1980<br/><ref name=OICAmore/><ref name=WMVD/><ref name=Mich/><ref name=UAM>[http://148.206.53.231/UAM3513.PDF UNIVERSIDAD AUTONOMA METROPOLITANA UNIDAD El sector automotriz Mexicano ante el tratado de libre comercio de america del norte, 1994]{{مردہ ربط|date=December 2020 |bot=InternetArchiveBot }}</ref> !! 1970<br/><ref name=OICAmore/><ref name=WMVD/><ref name=Mich/><ref name=UAM/> !! 1960<br/><ref name=OICAmore/><ref name=WMVD/><ref name=Mich/><ref name=UAM/> !! 1950<br/><ref name=OICAmore/><ref name=WMVD/> !! بہترین<br/>معطیات<br/><ref name=OICAmore/><ref name=WMVD/><ref name=RITA/><ref name=FREY>{{Cite web |url=http://www.freyssenet.com/files/* |title=Production automobile mondiale par continent et pour les principaux pays constructeurs,1898 2011.xls Production automobile mondiale par continent et pour les principaux pays constructeurs,1898-2011 (Tableau mde, contint, grds pays) |access-date=2013-01-28 |archive-date=2008-04-05 |archive-url=https://web.archive.org/web/20080405053803/http://freyssenet.com/files/%20Division%20mate%CC%81rielle%20et%20organisationnelle%20du%20travail%20d%20aiguillage%20des%20trains.pdf |url-status=dead }}</ref><ref name=IMF2000/><ref name=Mich/> !! بہترین<br/>سال<br/><ref name=OICAmore/><ref name=WMVD/><ref name=RITA/><ref name=FREY/><ref name=IMF2000/><ref name=Mich/> |
||
|- |
|- |
||
|—|| {{noflag}}'''دنیا'''||align="right"| 80,092,840 ||align="right"| 77,629,127 ||align="right"| 66,482,439 ||align="right"| 58,374,162||align="right"|50,046,000 ||align="right"| 48,553,969 ||align="right"| 38,564,516 ||align="right"| 29,419,484 ||align="right"| 16,488,340 ||align="right"| 10,577,426 ||align="right"| 80,092,840 ||align="right"| 2011 |
|—|| {{noflag}}'''دنیا'''||align="right"| 80,092,840 ||align="right"| 77,629,127 ||align="right"| 66,482,439 ||align="right"| 58,374,162||align="right"|50,046,000 ||align="right"| 48,553,969 ||align="right"| 38,564,516 ||align="right"| 29,419,484 ||align="right"| 16,488,340 ||align="right"| 10,577,426 ||align="right"| 80,092,840 ||align="right"| 2011 |
||
حالیہ نسخہ بمطابق 17:16، 28 فروری 2024ء
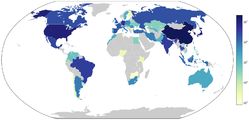
یہ فہرست ممالک بلحاظ موٹر گاڑی پیداوار ہے جس کی معلومات بین الاقوامی تنظیم برائے موٹر گاڑی ساز (Organisation Internationale des Constructeurs d'Automobiles) سے لی گئی ہیں۔
-
 2009
2009 -
 2013
2013


| درجہ | ملک / علاقہ | 2011 [1][2] |
2010 [2][3] |
2005 [4] |
2000 [5][6] |
1995 [6][7] |
1990 [8][9][10] |
1980 [8][9][10][11] |
1970 [8][9][10][11] |
1960 [8][9][10][11] |
1950 [8][9] |
بہترین معطیات [8][9][6][12][7][10] |
بہترین سال [8][9][6][12][7][10] |
|---|---|---|---|---|---|---|---|---|---|---|---|---|---|
| — | دنیا | 80,092,840 | 77,629,127 | 66,482,439 | 58,374,162 | 50,046,000 | 48,553,969 | 38,564,516 | 29,419,484 | 16,488,340 | 10,577,426 | 80,092,840 | 2011 |
| 01 | 18,418,876 | 18,264,667 | 5,708,421 | 2,069,069 | 1,434,772 | 509,242 | 222,288 | 87,166 | 22,574 | 18,418,876 | 2011 | ||
| 02 | 8,653,560 | 7,761,443 | 11,946,653 | 12,799,857 | 11,985,457 | 9,782,997 | 8,009,841 | 8,283,949 | 7,905,119 | 8,005,859 | 13,024,978[13] | 1999[14] | |
| 03 | 8,398,654 | 9,625,940 | 10,799,659 | 10,140,796 | 10,195,536 | 13,486,796 | 11,042,884 | 5,289,157 | 481,551 | 31,597 | 13,486,796 | 1990 | |
| 04 | 6,311,318 | 5,905,985 | 5,757,710 | 5,526,615 | 4,667,364 | 4,976,552 | 3,878,553 | 3,842,247 | 2,056,149 | 306,064 | 6,311,318 | 2011 | |
| 05 | 4,657,094 | 4,271,941 | 3,699,350 | 3,114,998 | 2,526,400 | 1,321,630 | 123,135 | 28,819 | 4,657,094 | 2011 | |||
| 06 | 3,936,448 | 3,536,783 | 1,638,674 | 801,360 | 636,000[16] | 362,655 | 113,917 | 76,409 | 51,136 | 14,688 | 3,936,448 | 2011 | |
| 07 | 3,406,150 | 3,381,728[17] | 2,530,840 | 1,681,517 | 1,629,008 | 914,466 | 1,165,174 | 416,089 | 133,041 | 3,406,150[17] | 2011[18] | ||
| 08 | 2,680,037 | 2,345,124 | 1,624,238 | 1,935,527 | 935,017 | 820,558 | 490,006 | 192,841 | 49,807 | 2,680,037 | 2011 | ||
| 09 | 2,353,682 | 2,387,900 | 2,752,500 | 3,032,874 | 2,333,787 | 2,053,350 | 1,181,659 | 539,132 | 58,209 | 0,253 | 3,032,874 | 2000 | |
| 10 | 2,294,889 | 2,227,742 | 3,549,008 | 3,348,361 | 3,474,705 | 3,768,993 | 3,378,433 | 2,750,086 | 1,369,210 | 357,512 | 3,919,776[19] | 1989[20] | |
| 11 | 2,134,893 | 2,071,026 | 2,688,363 | 2,961,636 | 2,407,999 | 1,947,106 | 1,369,607 | 1,159,504 | 397,739 | 387,726 | 3,057,000 | 1999 | |
| 12 | 1,988,036 | 1,403,244 | 1,351,199 | 1,202,589 | 994,000[22] | 1,074,008 | 1,884,000 | 737,300 | 490,200 | 342,200 | 1,988,036 | 2011 | |
| 13 | 1,648,505 | 1,599,454 | 817,200 | 141,546 | 44,665 | 161,000 | 35,000 | 1,648,505 | 2011 | ||||
| 14 | 1,463,999 | 1,393,463 | 1,803,109 | 1,813,894 | 1,765,000[23] | 1,565,957 | 1,312,914 | 2,098,498 | 1,810,700 | 783,672 | 2,332,376 | 1963 | |
| 15 | 1,457,798 | 1,644,513 | 1,122,712 | 325,888 | 533,200 | 304,843 | 73,347 | 22,055 | 1,644,513 | 2010 | |||
| 16 | 1,199,834 | 1,076,385 | 602,237 | 455,492 | 216,000 | 242,000 | 233,112 | 169,920 | 75,000 | 31,000 | 1,199,834 | 2011 | |
| 17 | 1,189,131 | 1,094,557 | 879,452 | 430,947 | 282,000 | 209,150 | 50,881 | 25,000 | 1,189,131 | 2011 | |||
| 18 | 837,948 | 702,508 | 500,710 | 379,300 | 292,710 | 103,000 | 837,948 | 2011 | |||||
| 19 | 837,132 | 869,376 | 613,200 | 504,972 | 381,000 | 347,975 | 417,834 | 113,087 | 37,000 | 1,000 | 950,908[24] | 2008 | |
| 20 | 828,771 | 716,540 | 319,755 | 339,632 | 286,000 | 99,639 | 281,793 | 219,599 | 89,000 | 828,771 | 2011 | ||
| 21 | 790,348 | 838,400 | 1,038,352 | 1,738,315 | 1,667,270 | 2,120,850 | 1,610,287 | 1,854,252 | 644,633 | 127,847 | 2,220,774 | 1989 | |
| 22 | 639,763 | 556,941 | 218,349 | 181,783 | 22,600 | 0 | 0 | 0 | 0 | 0 | 639,763 | 2011 | |
| 23 | 562,386[25] | 555,302 | 928,965 | 1,033,294 | 468,000 | 1,248,290 | 923,426 | 296,000 | 1,000[6][26] | 1,248,290 | 1990 | ||
| 24 | 533,695 | 567,715 | 563,408 | 282,830 | 164,000 | 191,580 | 104,227 | 567,715 | 2010 | ||||
| 25 | 532,545 | 472,049 | 525,227 | 345,297 | 334,779 | 404,766 | 297,573 | 587,719 | 2006 | ||||
| 26 | 343,296 | 303,456 | 446,345 | 361,800 | 406,000 | 382,000[6][27] | 446,345 | 2005 | |||||
| 27 | 335,232 | 350,912 | 194,802 | 78,165 | 93,000 | 94,000[6][27] | 124,000 | 59,000 | 12,000 | 350,912 | 2010 | ||
| 28 | 224,193 | 243,495 | 394,713 | 347,122 | 331,000 | 284,000[6][27] | 361,000 | 475,000 | 204,000 | 58,000 | 498,000 | 1974 | |
| 29 | 217,733[28] | 222,022[28] | 94,437 | 32,273 | 0 | 0 | 0 | 0 | 0 | 222,022 | 2010 | ||
| 30 | 202,800 | 211,461 | 152,015 | 137,398 | 53,000 | 3,000 | 346,055 | 2008 | |||||
| 31 | 188,969[25] | 217,084 | 339,229 | 301,343 | 490,000 | 344,000[6][27] | 317,000 | 311,000 | 129,000 | 28,000 | 494,000 | 1999 | |
| 32 | 192,242 | 158,723 | 226,834 | 245,784 | 57,000 | 26,000[6][27] | 91,000 | 271,030 | 1998 | ||||
| 33 | 174,119 | 205,711 | 187,247 | 98,953 | 212,749 | 2009 | |||||||
| 34 | 162,194 | 152,970 | 153,393 | 31,500 | 169,861 | 2007 | |||||||
| 35 | 152,505 | 104,814 | 253,279 | 141,026 | 68,000 | 20,000[6][27] | 14,000 | 7,000 | 13,000 | 274,932 | 2006 | ||
| 36 | 102,409 | 104,357 | 135,425 | 21,190 | 96,400 | 153,000 | 175,458 | 2006 | |||||
| 37 | 104,654 | 83,133 | 215,759 | 31,255 | 206,700 | 115,700 | 7,500 | 18,300 | 423,127 | 2008 | |||
| 38 | 81,731 | 116,683 | 123,425 | 59,765 | 123,425 | 2005 | |||||||
| 39 | 73,151[29] | 94,132 | 102,204 | 98,823 | 132,000 | 111,000[6][27] | 97,000 | 79,000 | 19,000 | 287,000 | 1999 | ||
| 40 | 59,477 | 42,066 | 33,992 | 31,314 | 59,477 | 2011 | |||||||
| 41 | 53,921 | 65,625 | 64,492 | 38,877 | 107,000 | 213,402 | 2007 | ||||||
| 42 | 32,466 | 41,714 | 109,333 | 23,979[30] | 34,850[28] | 43,000 | 109,333 | 2005 | |||||
| 43 | 31,181 | 42,286 | 31,600[28] | 6,862[30] | 42,286 | 2010 | |||||||
| 44 | 26,234[28] | 18,033 | 14,179 | 12,740 | 1988 | ||||||||
| 45 | 24,343 | 15,249 | 26,995 | 19,324 | 40,100 | 29,800 | 18,700 | 2,400 | 40,100 | 1980 | |||
| 46 | 23,522 | 22,335 | 32,254 | 41,047 | 41,047 | 2000 | |||||||
| 47 | 2,540 | 6,665 | 21,644 | 38,926 | 38,926 | 2000 | |||||||
| - | 0 | 4,700 | 6,660[28] | 5,245[30] | 10,804 | 2007 | |||||||
| - | 0 | 90,000 | 123,000 | 1982 | |||||||||
| ? | 47,000 | 47,000 | 1981 | ||||||||||
| ? | 21,000 | 12,000 | 21,000 | 1990 | |||||||||
| ? | 3,000 | ||||||||||||
| ? | |||||||||||||
| — | 17,707,126[31] | 17,107,350<[31] | 18,176,860[32] | 17,142,142[33] | 15,105,049[33] | - | - | - | - | - | 19,717,643 | 2007 | |
| قابل ذکر 2 سابقہ ممالک | |||||||||||||
| — | - | - | - | - | - | 2,039,600 | 2,199,200 | 916,118 | 523,591 | 362,985 | 2,247,500 | 1985 | |
| — | - | - | - | - | - | 239,000[6][27] | 278,000 | 124,000 | 16,000 | 1,000 | 318,300 | 1988 | |
| — | - | - | - | - | - | 242,000 | 233,112 | 169,920 | 75,000 | 31,000 | 242,000 | 1990 | |
| — | - | - | - | - | - | - | 216,585 | 153,378 | 77,350 | 8,243 | 264,444 | 1986 |
مزید دیکھیے[ترمیم]
فہرست ممالک بلحاظ فی کس محرکی ناقل
حوالہ جات[ترمیم]
- ↑ OICA 2011 statistic
- ^ ا ب OICA. World Motor Vehicle Production by country 2010-2011
- ↑ OICA 2010 statistic
- ↑ OICA 2005 statistic
- ↑ OICA 2000 statistic
- ^ ا ب پ ت ٹ ث ج چ ح خ د ڈ ذ RITA. Table 1-23: World Motor Vehicle Production, Selected Countries آرکائیو شدہ (Date missing) بذریعہ bts.gov (Error: unknown archive URL)
- ^ ا ب پ "IMF Auto Report 2000" (PDF)۔ 17 اگست 2011 میں اصل (PDF) سے آرکائیو شدہ۔ اخذ شدہ بتاریخ 17 اگست 2011
- ^ ا ب پ ت ٹ ث ج OICA: Production Statistics
- ^ ا ب پ ت ٹ ث ج Ward's: World Motor Vehicle Data 2007. - Wards Communications, Southfield MI 2007, ISBN 0910589534
- ^ ا ب پ ت ٹ ث "by%20celected%20country"+motor+vehicles+-wikipedia&source=bl&ots=7L4HM4sC_f&sig=gcwCbObJhdizBq6wdYFraFKozFM&hl=ru&sa=X&ei=AYQfUNmAJIyEhQexrYDgCg&ved=0CEYQ6AEwAA#v=onepage&q="12,702,782"%20motor%20vehicles%20&f=false Michigan Statistical Abstract 1996. Table XIV-1 - Univercity of Michigan, 1996 ISBN 0-472-08370-8
- ^ ا ب پ UNIVERSIDAD AUTONOMA METROPOLITANA UNIDAD El sector automotriz Mexicano ante el tratado de libre comercio de america del norte, 1994[مردہ ربط]
- ^ ا ب "Production automobile mondiale par continent et pour les principaux pays constructeurs,1898 2011.xls Production automobile mondiale par continent et pour les principaux pays constructeurs,1898-2011 (Tableau mde, contint, grds pays)" (PDF)۔ 05 اپریل 2008 میں اصل سے آرکائیو شدہ۔ اخذ شدہ بتاریخ 28 جنوری 2013
- ↑ 15,168,000 according to other sources
- ↑ 1977 according to other sources
- ↑ West جرمنی before 1990
- ↑ 544,989 according to other sources
- ^ ا ب 3,648,358 according to other sources
- ↑ 2010
- ↑ 4,200,000 according to other sources
- ↑ 1979 according to other sources
- ↑ روسی سوویت وفاقی اشتراکی جمہوریہ before 2000
- ↑ 1,038,912 according to other sources
- ↑ 1,907,045 according to other sources
- ↑ 1,006,000 according to other sources
- ^ ا ب cars only
- ↑ 1961
- ^ ا ب پ ت ٹ ث ج چ 1991
- ^ ا ب پ ت ٹ ث estimate
- ↑ DAF missing
- ^ ا ب پ manufacturers' data
- ^ ا ب EU 27 countries
- ↑ EU 25 countries
- ^ ا ب EU 15 countries